The global energy industry has been transformed in the last five years in ways and to an extent that few would have thought credible.
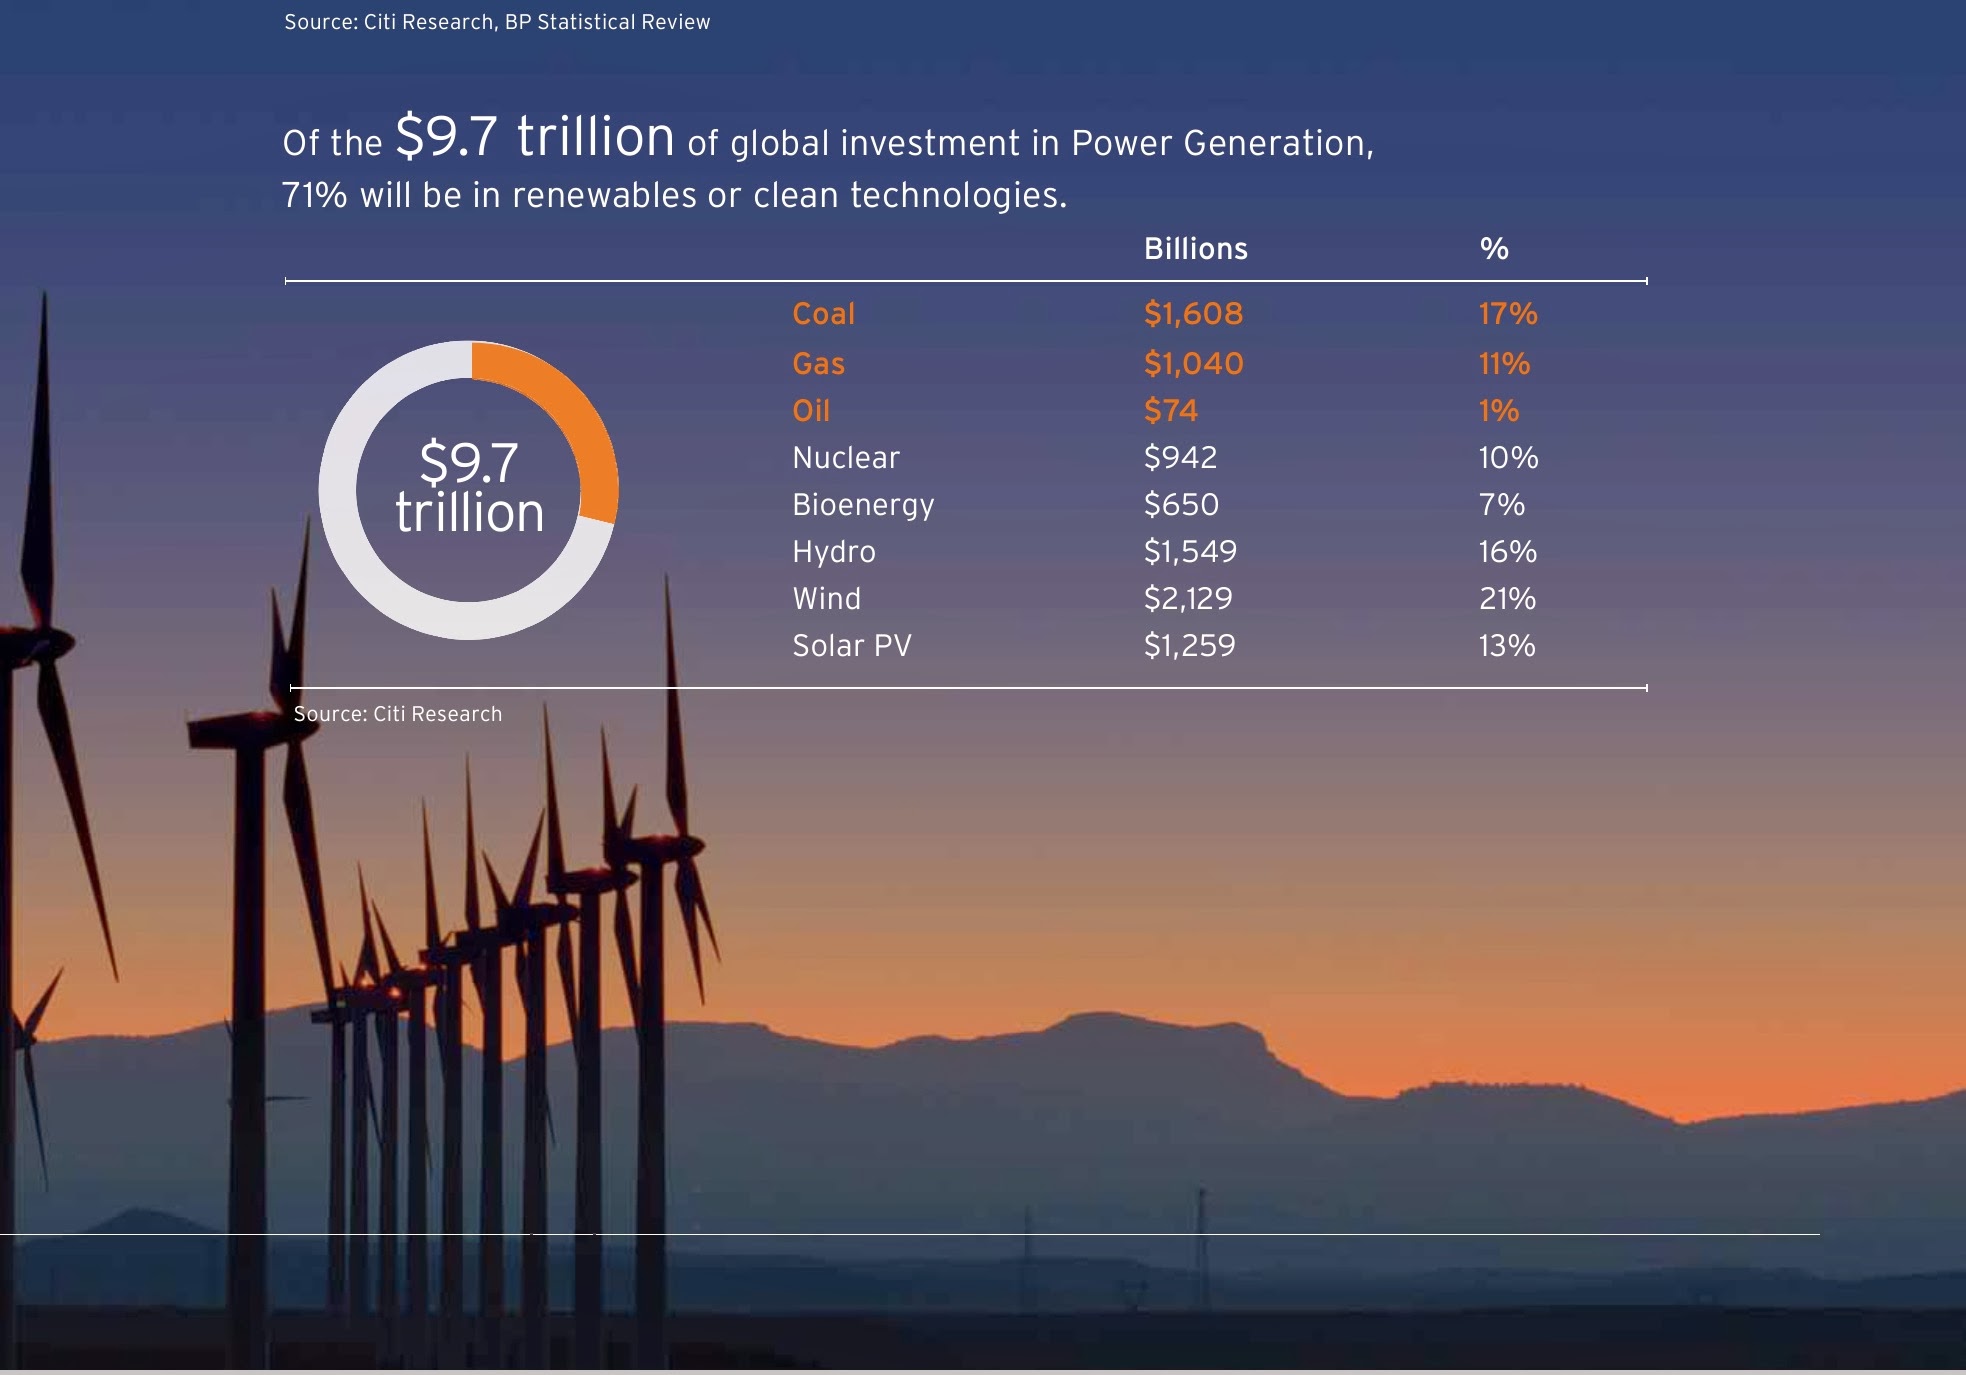
Of the $9.7 trillion of global investment in Power Generation, 71% will be in renewables or clean technologies.
The emergence of shale gas has transformed the U.S. energy market while Germany has seen some gas-fired power stations running for less than 10 days a year due to the impact of solar leading utility owners to issue profit warnings. Developed markets now spend more on renewable capital expenditures than they do on conventional generation, largely due to uncertainty over commodity pricing and likely future utilisation rates, while the legacy of Fukushima has seen Japan burning gas at $16-17/mmbtu while the U.S. basks in $3 shale, driving the introduction of the world’s most attractive solar subsidy scheme and catapulting Japan to be the world’s second largest solar market.
Conversely, the intermittency of renewables has led to the greater demand for the flexibility of gas-fired power plants in some markets. So, fuel and technology substitution is happening – and not just in developed markets. The shift in emerging markets is less marked, but is nonetheless there. The voracious appetite for power displayed by emerging markets will engender a higher level of new conventional generation (in particular coal), though gas is gradually taking demand from coal and renewables are forecast to represent 10% of new installed power generation capacity in China over the next two years. Despite these shifts, the analysis of individual fuel and technology cost curves – a key determinant in setting the market price – has continued largely on a standalone basis, with limited emphasis on the risks of substitution.
Accordingly, in this report we have combined the work of our alternative energy oil & gas, mining (coal), utility and commodity research teams to create an integrated energy cost curve, which allows us to assess the impact and risks of this substitutional change across all fuel and technology types. Importantly, this integrated curve looks at incremental energy demand and supply, meaning relatively small changes in the mix can have a material impact on the returns of projects, particularly those at the upper end of the cost curve. More